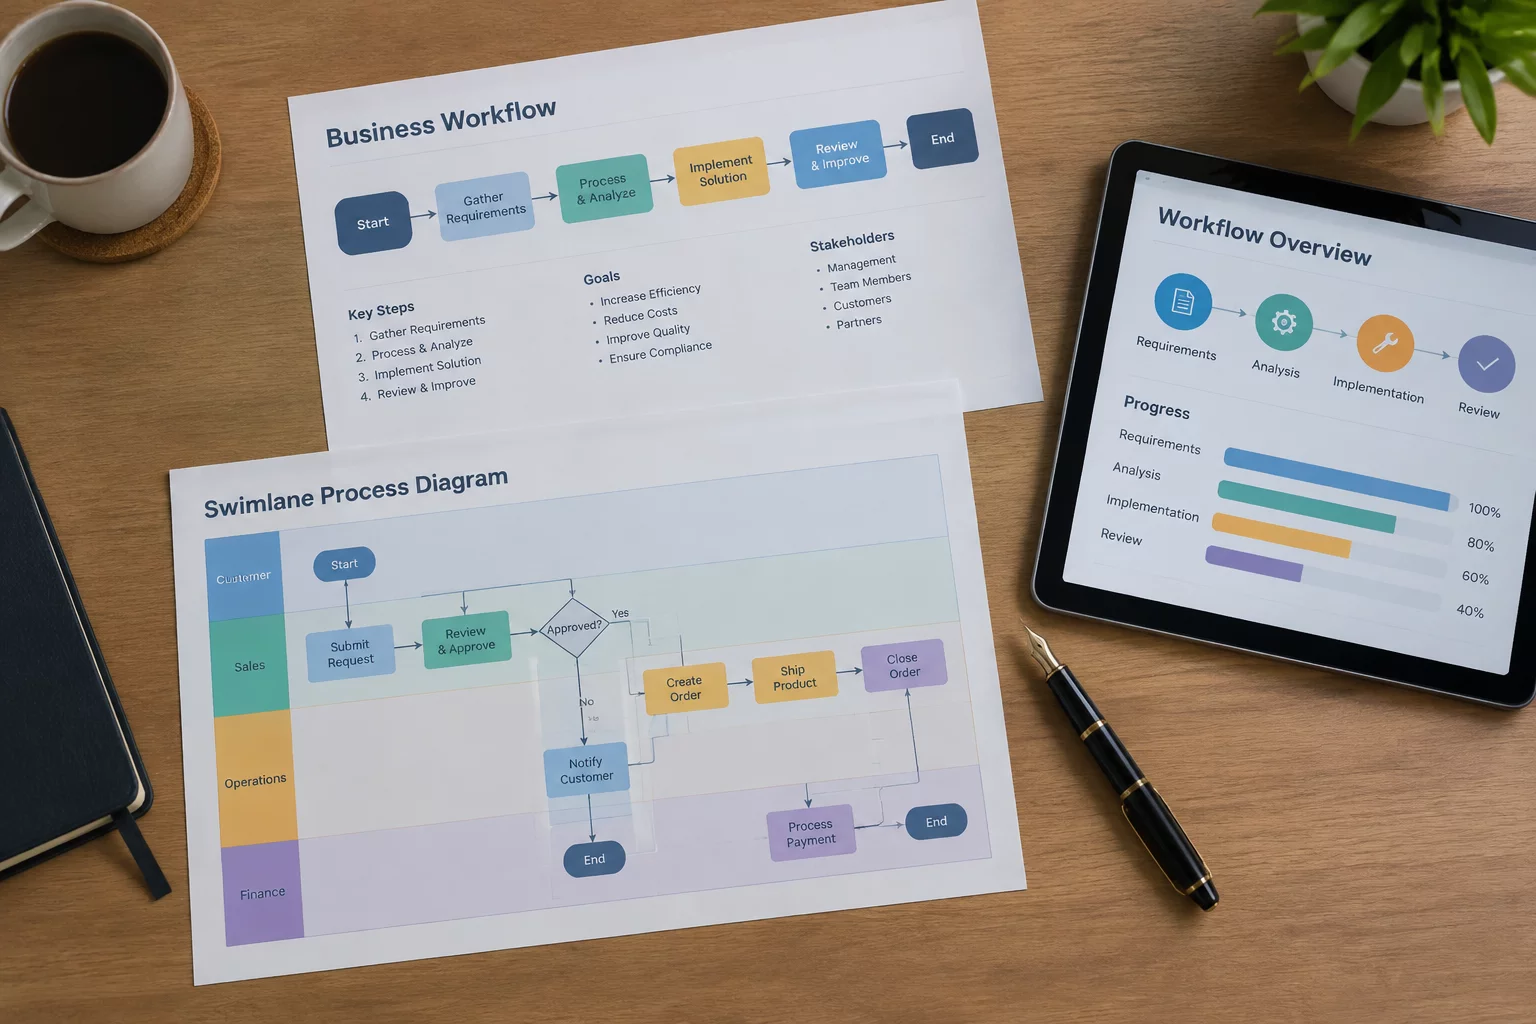
Demystifying Operational Blind Spots with Structured Mapping
Most organizational friction occurs not within isolated tasks, but directly along the boundaries where deliverables change custody. When departmental boundaries remain vague, individual team members develop informal workarounds. These informal habits quickly compound into invisible delays, conflicting assumptions, and dropped requirements. Comprehensive process mapping serves as an operational mirror, illuminating exactly where responsibilities fracture and where critical context dissolves during delivery handoffs.
Adopting structured diagramming disciplines allows organizations to transition from reactive troubleshooting to proactive structural governance. By tracking input artifacts, verification gates, and downstream handoff criteria, teams expose systemic bottlenecks long before they trigger production incidents or missed contractual delivery milestones.
Facing Transition Bottlenecks Across Department Boundaries?
Our workflow architects audit cross-departmental transition points, identify latent communication lags, and implement standardized visual handoffs across your teams.
Empirical Benchmarks for Process Gap Detection
Evaluating operational performance requires quantitative baselines. Field studies demonstrate substantial variance between unmapped tribal-knowledge systems and visually mapped governance environments. The following metrics illustrate measurable shifts when structured transition mapping protocols are methodically enforced across enterprise pipelines.
| Operational Parameter | Observed Specification | Target Benchmark |
|---|---|---|
| Handoff Latency Rate | 42.6 hours per transition | < 8.5 hours per transition |
| Undocumented Step Prevalence | 31% of total workflow tasks | < 3% across verified systems |
| Artifact Transfer Completeness | 68% first-pass acceptance | > 96% verification score |
| Rework Loop Frequency | 2.4 revisions per cycle | < 0.2 revisions per cycle |
Architecting a Resilient Process Map: Step-by-Step Execution
Constructing an actionable process model requires deliberate scoping. Begin by establishing unambiguous system boundaries: define where the trigger originates and where the final business deliverable settles. Resist the temptation to map aspirational future states immediately. Capturing existing friction points, shadow channels, and manual spreadsheets provides the evidentiary baseline essential for meaningful continuous optimization.
Three-Tier Audit and Verification Protocol
To guarantee that visual models match everyday shop-floor realities, engineering managers and operations leads should institute this structured three-stage validation protocol:
- Conduct gemba walks and task shadowing with frontline operators rather than relying solely on manager recollections.
- Define explicit acceptance criteria and input artifacts for every swimlane boundary crossing point.
- Stress-test exception scenarios by mapping edge cases, approval escalations, and rejection routing channels.